Flow cytometry is a fluorescence-based assay that enables measurement of multiple characteristics, simultaneously, such as population counts and protein abundance, from individual cells suspended in a solution. It is a powerful tool that enables rapid, quantitative, and accurate measurement of cellular characteristics and provides unparalleled insight into the heterogeneity of cellular populations.
This is achieved using instrumentation that directs a single stream of cells past a light source and measures the resulting scatter and emission of light energy in various wavelengths. Researchers use fluorescent molecules with different excitation and emission characteristics so that they can be combined, detected, and differentiated to provide multiple readouts from a single cell. These fluorescent molecules may be attached to antibodies targeting specific proteins or protein modifications, or they may be dyes that directly bind to cellular components.
Flow cytometry is a highly versatile application that can provide simple, single-target readouts or complex subpopulation phenotyping and cell signaling analysis. Because flow cytometry relies on cells being in suspension in order to enable them to flow past the illumination source, it is readily compatible with biological samples where the cells naturally exist as a single-cell suspension (eg, white blood cells). However, adherent cells and even tissue samples may be dissociated and analyzed by flow cytometry as single-cell suspensions.
Flow cytometry is ideally suited for experiments where quantitative information is desired at a single cell level, to gain understanding at the cellular level and/or at the population level. The quantitative information being analyzed may provide insight into the number of cells of a given type, the amount of a specific protein present in that cell type, or the functional activity of that protein, to name several examples. Because multiple readouts are collected simultaneously, flow cytometry also enables correlation between those readouts at a cellular level.
Contrast this to applications such as western blotting that irreversibly combine populations of cells into a single readout. Flow cytometry allows researchers to ask complex questions, such as how the activity of 2 key signaling pathways in 3 immune cell types changes in response to a treatment, and answer the question within a few hours by labeling and running a single sample on a flow cytometer. The same question would take days of work to answer by western blot.
Not all biological research questions are capable of being addressed with flow cytometry. Spatial distribution of cells in tissue cannot be assessed using flow cytometry, since the sample needs to be dissociated into a single-cell suspension prior to analysis. For that analysis, immunohistochemistry or tissue-based immunofluorescence are preferred. Fine-scale subcellular analysis is more suited to analysis by fluorescent and/or confocal microscopy; though, imaging flow cytometers are making rapid progress on this front. Analysis of genetic mutations or large-scale mRNA analysis is better left to sequencing instruments. However, when it comes to rapid cell level quantification, few assays can top flow cytometry.
A common use of flow cytometry in cellular biology is the identification and quantification of the cell types present in a sample. The identification of the cells is enabled by the fact that different cell types express different proteins on their surface. These proteins can be specifically targeted by antibodies, effectively adding a colored flag that differentiates one cell type from another.
This process, known as immunophenotyping, enables researchers to understand and monitor the number and percentage of cell types present in a heterogeneous population. Immunophenotyping is useful in characterizing the various components of the immune system, as these cells exist in suspension within the blood and the differential surface proteins are well-characterized.
Immunophenotyping is enabled by the fluorescent labeling of antibodies, a process known as conjugation. When antibodies targeting different proteins are conjugated to dyes that fluoresce in different colors, they can be analyzed independently even when detected simultaneously by the flow cytometer. The process of adding multiple antibodies at the same time is known as multiplexing. Multiplexing can involve only 2 antibodies simultaneously or can extend to large panels of antibodies. These panels enable the immunophenotyping of multiple immune cell types within a single sample and has enabled deeper understanding of the subpopulations of various key immune cell types, such as T-Cells, B-Cells, and monocytes.
Flow cytometry is the method of choice for immunophenotypic analysis because it is extremely fast, quantifying thousands of cells per second. Experimental setup can take less than 30 minutes, and the ability to detect multiple readouts in a single assay means samples can be labeled, run, and analyzed in under an hour. Contrast this to western blotting, in which distinct populations may only be analyzed using antibody-based enrichment steps to selectively purify the cells. This adds time to an assay that is already lengthy by comparison and does not provide cell-level analysis to assess heterogeneity in the purified population.
Another advantage of phenotyping using flow cytometry is that the method is compatible with live cells. Thus, some instruments enable specific populations of cells to be retained after analysis for subsequent experimentation. This functionality is generally restricted to instruments known as sorters.
The characteristics being measured by a flow cytometer can be used in real time to physically sort cells into separate containers. This process requires a specific type of flow cytometer known as a cell sorter and is called fluorescence activated ell sorting (FACS). A specific fluorescent readout or set of readouts will be defined as the trigger to put that cell in a specific container. Those readouts may be from fluorescent proteins within the cells or from fluorescent antibodies labeling the cell. Immunophenotyping markers that are exposed on the cell surface are frequently used in FACS, because they can be labeled with an antibody while the cell is alive. Researchers often prefer to sort live cells, so that subsequent experimentation may be performed using the isolated population.
Most critical biological processes happen inside the cell. So, while proteins on the cell surface may be used to identify cell types, the abundance and activity of intracellular proteins drives nearly all cellular processes. The ability to quantify intracellular proteins provides mechanistic insight into cellular biology and enables discoveries of aberrant activity in disease states.
The quantity of individual proteins is not the only way cells are able to regulate and perform biological activities. When a cell needs to convey a signal from receptors on the cell surface, or in response to conditions within the cell itself, post-translational modifications (PTMs) are often a key method of perpetuating that signal. PTMs are not encoded in the genetic sequence defining the protein, but rather are changes made after the protein has been translated. PTMs often involve the modification of a single amino acid within the protein through the addition of a small molecule, such as a phosphate, acetyl, or methyl group. PTMs can also involve the addition of a small protein, such as ubiquitin, or even the cleavage of a protein at a specific amino acid sequence.
The purpose of PTMs is generally to alter the activity, stability, or function of a protein, and principle among the PTMs is phosphorylation. Phosphorylation is the most well-studied modification used in cell signaling cascades. In the phosphorylation process, a phosphate group is added to an amino acid within the protein, usually serine, threonine, or tyrosine. The phosphorylation of that amino acid, sometimes in conjunction with other concurrent phosphorylation events, often changes the function of the protein. Phosphorylation of enzymes can act as a switch to turn the enzyme on, enabling it to act on its specific substrate. The function of that enzyme may be to phosphorylate a series of target proteins, enabling or disabling their function within the cell. Phosphorylation has the advantage of allowing the cell to have key functional proteins already synthesized and poised to perform an activity, but held in an inactive state until that activity needs to be performed. When a signal indicates that the cell needs to carry out that activity, the cell does not need to spend time manufacturing the enzymes and proteins necessary to perform that activity, but can simply throw the “on” switch using a rapid phosphorylation cascade.
Antibodies have specificity such that they can be designed to bind to a protein only when that protein is phosphorylated at a specific amino acid. If the protein is only functional when phosphorylated at that amino acid, then the amount of antibody binding becomes a direct readout of the functional activity of that protein within the cell. These are known as phospho-specific antibodies, and they provide researchers with powerful tools to understand the impact an experimental treatment may have on the biological activity of the cell. They enable discoveries of compounds that specifically alter a biological process, which is frequently the first step in identifying potential therapeutic drugs.
Phosphorylation events are easily detected by flow cytometry using phospho-specific antibodies. In fact, with its sensitivity, quantification, and cell-level data acquisition, flow cytometry is ideally suited to the analysis of phosphorylation in cellular populations. This method has been termed “phospho-flow” to differentiate it from live-cell flow cytometry. The reason for this differentiation is due to the fact that nearly all phosphorylation of proteins happens within the cell, even for those proteins that span the cellular membrane. Thus, the use of phospho-specific antibodies necessarily requires a protocol that enables the antibody to cross the plasma membrane and reach targets within the cell. Furthermore, the cells must be fixed in order to stop biological activity and prevent the levels of phosphorylation from changing over the course of an experiment. Though fixation and permeabilization are not used in live-cell flow cytometry, the steps are simple, and no modification of the flow cytometer is needed in order to perform intracellular detection of phosphorylation or of protein levels in general.
The instrument used in flow cytometry is called a flow cytometer, often abbreviated to “cytometer.” Flow cytometers are composed of a fluidic system for cell handling and an optical system that includes a signal detector and processor for data acquisition. An instrument designed for FACS also contains a cell sorting component that enables cells to be directed into different capture vessels.
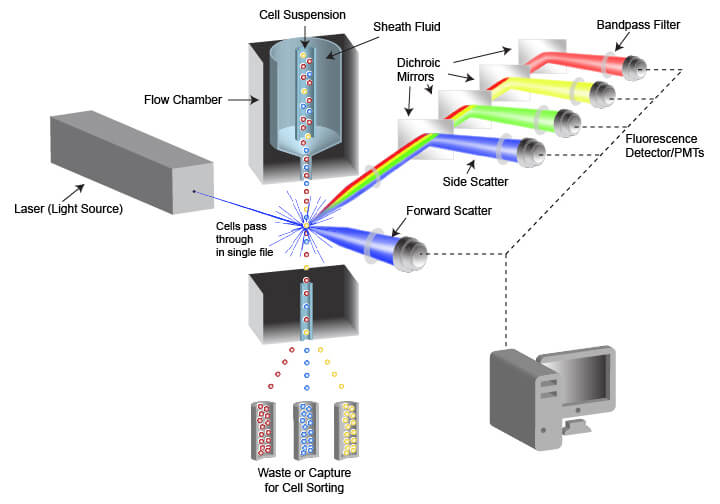
The fluidic system is designed to generate a uniform stream of single cells to ensure proper analysis when the cells are illuminated by the light source used for detection. This is accomplished using pressurized lines to inject cells from a sample tube into a flow chamber. The cell sample is drawn from a container (often a tube or multi-well plate) and is injected into the flow chamber in the center of a laminar stream of flowing liquid known as sheath fluid. The sheath fluid helps narrow the stream of cells through a process called hydrodynamic focusing, organizing the cells into a roughly single-file line. Some cytometers also use acoustic focusing to further align the cells. This enables cells to be equally illuminated and detected as they pass the optics system in the cytometer.
If the fluidics system is not well-calibrated, or if too many cells are present in the sample being analyzed, the cells will become jumbled and overlap when flowing past the optics system, preventing proper single-cell analysis. To reduce the likelihood of this occurring, many flow cytometers enable users to change the flow rate, or how rapidly the sample is injected into the sheath fluid. By slowing down injection rates while keeping sheath flow constant, a user is able to space out cells in a dense sample and regain single-cell flow past the detector.
The optical system of the flow cytometer includes the illumination source, filters, lenses, and collection optics. The illumination source frequently comprises 1 or more laser beams, with each laser emitting a different wavelength of light. The lasers illuminate the cell or other object flowing through the cytometer, and both scattered laser light and fluorescent emissions are collected. Two types of light scattering events are quantified by the flow cytometer. Forward scatter results from diffraction of the light parallel to the laser beam and is often a factor of the size of the object passing in front of the laser. Side scatter is the result of refraction of light at a 90° angle from the laser beam and is altered by differences in complexity and optical density of the object. Fluorescent emissions from the object frequently originate from fluorescent dyes that are being used in the assay but may also be caused by autofluorescence within a cell or from the object itself in the case of fluorescent beads. The intensity or amount of scattered light and fluorescent emissions are quantified by photodiodes (PDs) or photomultiplier tubes (PMTs), which convert the photons of light into numerical values that can be displayed and analyzed. There are multiple separate detectors, enabling the separate quantification of light scatter and of different wavelengths of emitted fluorescent light. The detectors do not differentiate between wavelengths of light, but rather the light is restricted to the desired range of wavelengths by filters placed in the path of the light.
In order to analyze specific targets by flow cytometry, cell components are fluorescently labeled. This can be accomplished by use of stand-alone fluorescent molecules (eg, cellular dyes) or fluorophore labeled antibodies (directly conjugated antibodies or using conjugated secondary antibodies)
Antibodies are critical tools in many biological assays, and flow cytometry is no exception. Antibodies have the ability to bind specifically to a single protein or protein modification and serve as a way to label those targets for detection. By labeling the target of interest, researchers can assess the abundance or activity of a protein in various cell types, disease states, treatment conditions, developmental stages, or other biological models.
Antibodies binding to different proteins do not interfere with one another; thus, multiple antibodies may be used for simultaneous detection of multiple targets. This is known as multiplexing. The limitation on the number of antibodies is the ability to measure each antibody independently of the others. In flow cytometry, this differential measurement is accomplished using fluorescent molecules known as fluorophores. Successful experiments require highly specific and validated antibodies coupled with robust fluorophores.
Fluorophores share a common trait of being able to emit light at a higher wavelength than the light that was used to illuminate the dye. For example, if a blue laser is used to illuminate the molecule known as green fluorescent protein (GFP), the protein absorbs the blue light and emits green light. The difference between the wavelengths of light that are absorbed from the wavelengths that are emitted is known as Stokes shift.
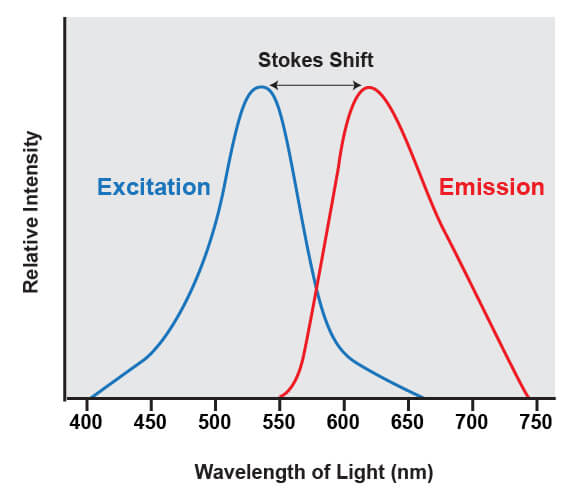
This shift is what enables the light from a fluorophore to be accurately quantified, because it enables the wavelengths of light from the excitation source to be filtered out. The excitation source is always much brighter than the emitted fluorescence from the fluorophores being analyzed, and if that light was not able to be removed it would overwhelm the detectors.
The range of light that a fluorescent dye absorbs is known as the “excitation” spectrum, while the light that it fluoresces upon excitation is known as the “emission” spectrum. Excitation and emission spectra are available for all common dyes and are presented as curves to show the amount of light absorbed or emitted at each wavelength.
This overview enables researchers to understand which dyes will work with their specific instrument. For the dye to be useful, the flow cytometer needs to have a laser that emits light within the excitation spectrum (preferably close to the peak, or maximum excitation wavelength), and be able to selectively detect light in the emission spectrum (again, optimally close to the peak of the emission curve).
Fluorophores range in size from small molecules to large proteins. Some fluorophores function independently as cellular dyes, binding to specific components of a cell. Examples of these are propidium iodide or DAPI, which are intercalating dyes that become fluorescent when bound to DNA, and viability dyes, which differentially label live and dead cells prior to fixation. Viability dyes enable researchers to eliminate dead cells from analysis even after the cells have been fixed and subsequently labeled with antibodies against intracellular targets.
Protein fluorophores such as GFP are unique in that they can be encoded by DNA. By adding the DNA sequence for GFP to the DNA sequence encoding a specific protein, researchers cause cells to produce the protein with its own fluorescent label. That enables the direct analysis of protein location and quantity in both in vitro and in vivo systems, with no subsequent labeling required. Fluorescent proteins like GFP can also be selectively expressed in specific cell types or in response to specific conditions. The ability to cause certain cells to “self report” with a fluorescent marker provides an opportunity to selectively count and/or sort those cells.
Commonly, the fluorophores used as readouts in a flow cytometry experiment are covalently bound to an antibody. This process is known as conjugation, and the antibody-fluorophore pairing is known as a conjugate. When a conjugated antibody is used in a cell-based assay, light emitted by the fluorophore serves as a direct indicator of the amount of antibody present in or on the cell. (Since cell membranes are light permeable, there is no significant decay of light emitted by fluorophores within the cell.) By using conjugates that specifically bind to a protein or protein modification, a researcher can directly quantify the target of interest in every cell, based on the level of fluorescence emitted by that cell. This process is referred to as direct detection, or direct flow cytometry.
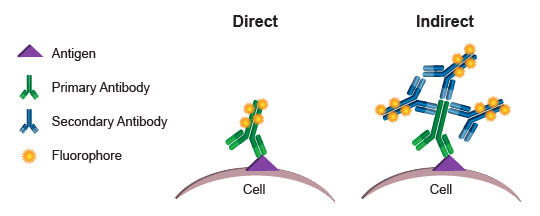
The alternative approach, indirect flow cytometry, utilizes a secondary antibody directed against immunoglobulins from the host in which the primary antibody was generated. In this method, the secondary antibody is conjugated to the fluorophore, leaving the primary antibody unmodified. This type of protocol may be preferred over direct flow cytometry when conjugation of the primary antibody may cause steric changes that affect specificity and function. It may also be preferred when increased signal is desired. More than 1 secondary antibody can bind to a primary antibody, thereby amplifying the signal derived from each antigenic molecule bound by the primary. A disadvantage of indirect flow cytometry is the limited number of antibodies that may be combined in an experiment. Each primary antibody must be raised in a different species, such as rabbit, goat, or mouse, to enable specific detection with the secondary antibodies. Two primary antibodies from a mouse, for example, could not be used in the same experiment because the anti-mouse secondary antibody would label both, making it impossible to differentiate the fluorescence contribution from each antibody independently.
Direct flow cytometry is generally preferred, because it eliminates the additional steps required when secondary antibodies are required. More importantly, it enables simultaneous use of many different antibodies in one assay, with the limiting factor becoming how many different fluorophores the flow cytometer is capable of exciting and discriminately quantifying. By combining more readouts into a single assay, a researcher maximizes the amount of information gathered and enables deeper understanding of the populations present. With precious or limited samples, the ability to gather multiparametric data simultaneously, rather than running each antibody individually, can be priceless.
| Direct Versus Indirect Staining for Flow Cytometry | |
|---|---|
| Direct: Directly conjugated antibodies |
|
| Indirect: Unconjugated primary antibodies + conjugated secondaries |
|
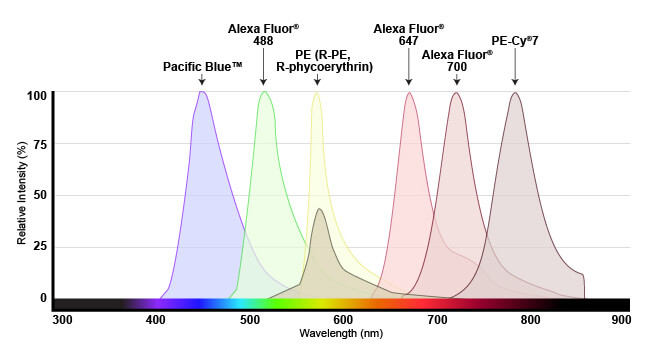
The development of specific and bright fluorophores with distinct spectra has increased the power and utility of flow cytometry. Narrow and distinct spectra make it easier to separate signals from multiple fluorophores or dyes within the same experiment, enabling the detection of more molecules of interest simultaneously. For successful use of multicolor flow cytometry, the panel design must take into account the intrinsic properties of the fluorophores combined in each experiment and the capabilities of the flow cytometer to filter and distinguish those fluorophores.
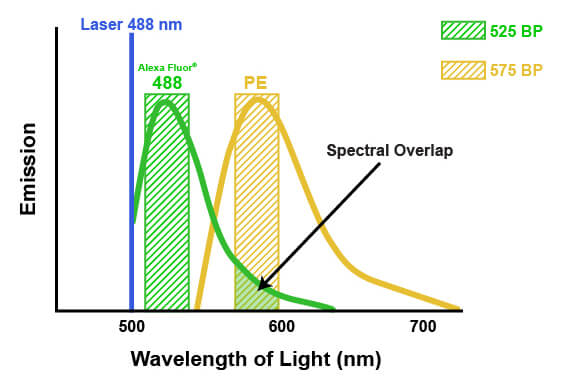
The emission spectra of fluorophores can spill into one another in multicolor flow cytometry. This spill is called spectral overlap, and it means that some light being detected and attributed to one fluorophore is actually originating from another fluorophore entirely (pictured below). If not accounted for, this signal may lead to misinterpretation of the biological system or the results of an experiment. The process of correcting for this spectral overlap is known as “compensation.” Compensation involves determining the amount of light being sent to the “wrong” detectors by a specific fluorophore and subtracting that amount from the value being reported by each of the affected detectors. The amount of spill can be determined by running each fluorophore individually and measuring the light in each detector, or by running “fluorescence minus one” experiments where one fluorophore at a time is removed. Compensation then involves a mathematical correction to the detected light, based on the known contribution from all the dyes. For example, suppose that 5% of the signal from a fluorophore normally measured by detector #1 is being quantified by detector #2. Compensation would then be applied to each cell by calculating 5% of the signal reported by detector #1 and subtracting that from the signal reported in detector #2. It is necessary to apply this on a per-cell basis, because the amount of signal that each cell has from the fluorophore in question will vary. Depending on the flow cytometer, color compensation may be calculated automatically by defining specific fluorescence controls, or it may be applied manually after the acquisition of the data.
When combining multiple antibodies in a single experiment, proper panel design is required to ensure usable data will be generated. It is recommended that the brightest fluorophore be used with the antibody binding the least abundant antigen. This increases the ability of the cytometer to accurately detect and quantify signal from the antibody over the background noise within the system. Secondly, fluorophores with different excitation wavelengths or widely separated emission spectra should be chosen to minimize spectral overlap. This will ensure that fluorescence from individual antibodies can be differentiated and will reduce or eliminate the need for compensation. Maintaining spectral separation becomes more difficult as the number of antibodies in the panel increases.
The use of tandem dyes (eg, APC-Cy®7, PerCP-Cy®5) can further increase the number of colors used in a single experiment. In general, tandem dyes increase the shift between the excitation and emission wavelengths. This allows the use of more antibodies with fluorophores excited at the same wavelength. Tandem dyes make use of an effect called fluorescence resonance energy transfer (FRET). During FRET, the first fluorophore is excited at a certain wavelength and, upon reaching its maximal energy state, the energy is transferred to a second fluorophore, leading to the emission of photons from the second fluorophore at a higher wavelength than would be obtained with the first fluorophore alone. PE and APC are both widely used to generate tandem dyes in combination with various cyanine dyes, such as Cy®5 or Cy®7.
Color compensation using tandem dyes can be more challenging and, when improperly applied, can cause artifacts. Proper compensation controls will reduce the risk of misinterpreting data in an experiment.
Sample preparation for flow analysis is a critical step and needs to be optimized for each assay or antibody. In general, the efficiency of antibody binding to the molecule of interest strongly depends on the conditions of the protocol (eg, fixation and permeabilization methods). The optimal protocol may be a function of the location of the molecule within the cell, the confirmation and accessibility of the epitope, and the potential for the antibody to bind unintended epitopes.
Antibody-based labeling methods for cellular analysis can be largely divided into cell surface or intracellular antigen staining. While cell surface staining can be performed on live cells, intracellular staining requires fixation and permeabilization of the cells. Fixation ensures the preservation of the cellular state at the time of fixation, preventing changes from occurring throughout the course of labeling and analyzing the cells. A common and effective fixative is formaldehyde, which fixes via protein cross-linking but leaves the cell membrane intact. Permeabilization is performed to enable antibodies to pass through cellular membranes to bind intracellular molecules. The choice of permeabilization agent can have significant influence on the specificity and functionality of antibodies used within the assay. Permeabilization is commonly achieved using solvents such as methanol or detergents like Triton™ X-100 or saponin. Saponin offers the least thorough permeabilization; it forms pores in the plasma membrane by associating with cholesterol but does not permeabilize intracellular membranes, such as the nuclear membrane or mitochondrial membrane. Triton™ X-100 and methanol will adequately permeabilize most intracellular membranes with methanol, providing the most thorough permeabilization. However, methanol can be disruptive to epitopes, and some antibodies, including some surface markers, will not work following methanol permeabilization.
Some antibodies work in a wide array of fixation and permeabilization conditions, while others require a limited set of reagents to bind correctly. This must be determined empirically, and careful testing should be performed when using an antibody in a new protocol.

Following fixation and permeabilization, the cells may be stained by incubation with diluted primary antibodies, followed by wash steps and resuspension prior to analysis. Surface and intracellular staining can be combined following fixation and permeabilization, provided the antibodies labeling surface proteins are compatible with the protocol.
As with any experiment, proper controls are essential for proper interpretation of the data acquired. Controls can indicate the efficacy of a treatment, the differences among samples, the correct color compensation, and the level of background signal, to name a few common uses. The determination of the level of background, or autofluorescence, allows determination of the real signal contributed by an antibody.
The level of background signal can be determined either by using unstained cells or by using isotype antibodies. Isotypes are antibodies whose binding domain does not target any molecule in the cell, but whose constant region (the non-binding domain) is consistent with the type of antibody used in the experiment, (eg, a rabbit IgG antibody. The isotype control should be conjugated to the same fluorophore as the experimental antibody to enable direct comparison. Isotypes provide an estimation for the binding that may occur with that class of protein; for example, cell surface molecules may bind to the constant region of the rabbit IgG antibody.
Though isotypes provide an estimate of the amount of unintended binding, they are not an indication of the specificity of antibodies being used in the experiment. Antibody specificity may be determined by comparing fluorescence acquired in known positive conditions (eg, endogenous expression, overexpression, treatments to induce protein modifications) with fluorescence acquired in known negative conditions (eg, knockout, endogenous negatives, treatments to inhibit protein modifications). Antibody specificity should be determined using the same protocol that will be used for the experiment.
In multicolor experiments, an important control for correctly estimating signal above background are fluorescence minus one (FMO) controls. An FMO control is generated by adding all the antibodies in a panel except 1. By analyzing the residual fluorescence in the “empty” channel, one can more accurately draw gates to determine where positive signal exists vs background. While an FMO control can be run for each antibody in a panel, it may not be necessary for fluorophores that are definitively separated from other colors in the panel.
Compensation controls will enable proper fluorescence compensation in multicolor experiments. This often consists of analyzing cells labeled with 1 fluorophore at a time, to determine the amount of spillover that occurs in channels other than the one used to detect that fluorophore. The intensity of the fluorescent signal measured in the control should be equivalent to what will be observed in the experiment itself. This ensures that the gain (voltage) set for each detector will match the experimental setup, since changes in these gains will alter the compensation required.
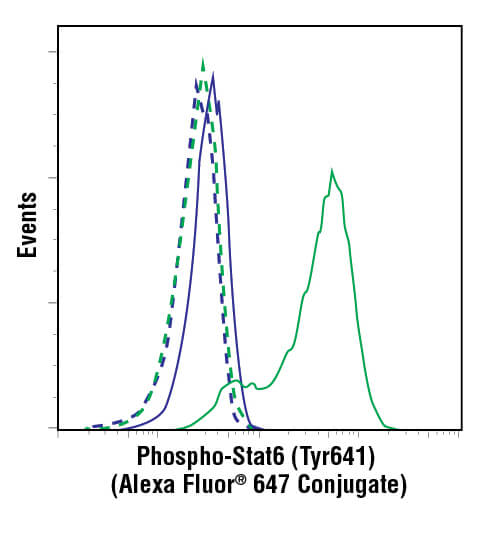
Flow cytometry data are commonly visualized in 1 of 2 ways: the scatterplot and the histogram. A scatterplot, also known as a dot plot (pictured below) enables 2 parameters to be displayed simultaneously, with each scaled along an axis. This is a powerful visualization for assessing the correlation of 2 readouts and is commonly used to display light scatter or fluorescence properties of the cell population.
A histogram (pictured below) is used for displaying 1 parameter at a time, with that readout scaled along the x-axis of the plot. The y-axis displays the frequency of occurrence, or how many cells were detected at each point along the x-axis. Usually, this display is used to assess fluorescence intensities across a population of cells.
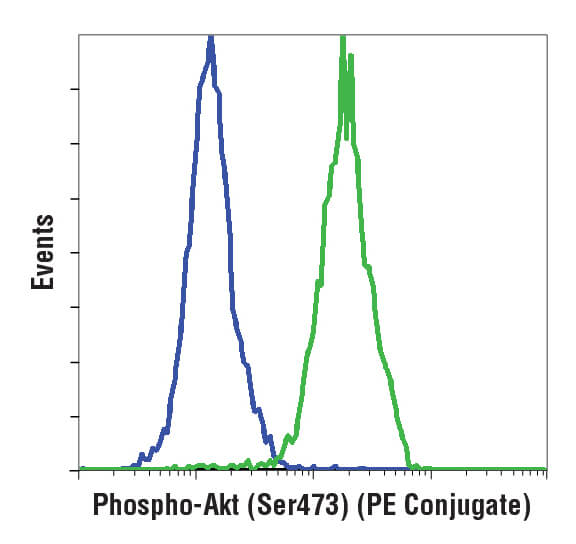
Understanding how to interpret both the histogram and the scatterplot is necessary for performing analysis of flow cytometry data.
One of the most important steps for flow cytometry experiments is data analysis. This step may be challenging, especially in complex experiments where the user is presented with a large amount of data. While flow cytometers have the benefit of providing many data points for each cell, maintaining an awareness and understanding of what each readout represents is critical in order to avoid errors in data manipulation or interpretation. This is important, because users are not able to truly put their eyes on the cells but must rely on the set of numerical values presented by the flow cytometer. Contrast this to assays such as western blots, microscopic analysis of immunofluorescent cells, or immunohistochemistry staining on paraffin embedded tissue. In those assays, direct visual analysis allows intuitive understanding of the quality of the sample being analyzed, the specificity of the antibodies used in the assay, and a better understanding of which data to keep or discard.
Properly harnessing each readout in flow cytometry enables users to perform powerful stepwise analyses, drilling down to a target population and gaining specific insights into the biology of those cells. This is enabled by one of the essential tools in flow cytometry data analysis: the gate.
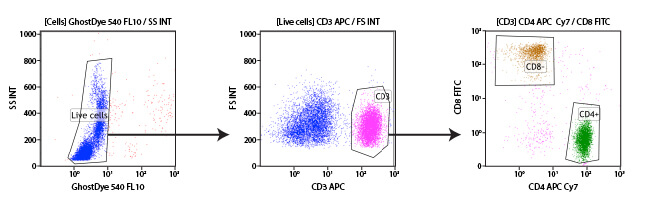
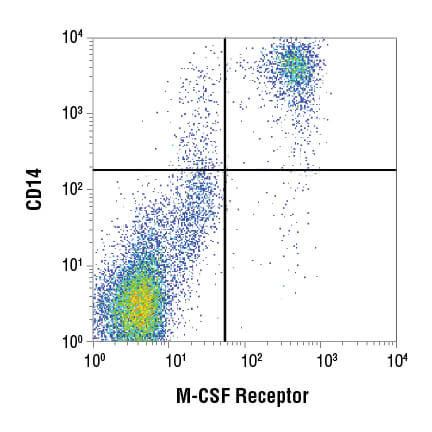
Gating is a data analysis method whereby a user selects a subset of the objects recorded by the flow cytometer in an experiment, enabling that subset to be analyzed independently of the overall population. Gating is performed in almost every experiment, in order to exclude unwanted debris or clumps of cells from the analysis or to obtain metrics for individual cell types within a heterogeneous sample. Most flow cytometer software makes gating easy, by allowing the user to draw the gates on scatterplots or histograms. Thus, the user can select the readouts they would like to use for identifying a specific subpopulation of interest, for example a CD marker that is only expressed on that subpopulation. Though the gate is created using one sample, it may then be reproducibly applied to all samples in an experiment and saved for use across multiple experiments. This enables researchers to be consistent in the manner in which a specific population is selected.
Subgating may also be performed. For example, a researcher may first create a gate which uses scatter profiles to select only single cells (excluding doublets and clumps of cells from the analysis). This single cell population may now be displayed on a second scatterplot and further selected for cells that show strong fluorescence indicating CD3 protein. These “CD3 positive” cells are T cells, and this subpopulation may now be visualized on a further scatterplot and broken down into CD4 and CD8 positive populations, the 2 major components of the circulating T cells. For each of the populations defined by a gate, the user is able to obtain data, including cell counts, fluorescence averages, and other metrics.
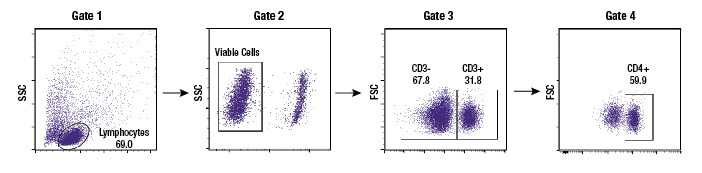
Once a population is gated or identified on the flow cytometer, a basic metric is the number of cells that are present within the defined population. The size of that population may then be reported as a cell count or may be represented as a percentage relative to the overall number of cells acquired in that sample. Frequently the percentage of cells will be reported from within multiple gates, with the gates shown in the analysis so that other people can understand where the researcher literally drew the line between one population and another. The display of gates and the percentage of cells within each gate are extremely effective at illustrating when cells transition from one state to another in response to a treatment.
Data acquired by photodiodes or photomultiplier tubes are presented in dimensionless numbers known as fluorescence intensities. No units are associated with the intensity and, as such, the numbers only serve to provide relative comparisons within the experiment. Fluorescence values cannot be compared from instrument to instrument, or even experiment to experiment, without some standard being run that would enable an understanding of how the values relate.
For the purposes of drawing conclusions or portraying characteristics of a population, the fluorescence intensities are often reported as mean fluorescence intensity or median fluorescence intensity (abbreviated to MFI), calculated for that population. The mean gives the user an average of the fluorescence intensities of all cells analyzed in a particular experiment. This value is strongly affected by outliers and, therefore, is not considered a robust measure (unless there is a desire to ensure outliers are considered). The median fluorescence intensity is also reported and is a more robust assessment, as it is not strongly affected by occasional outliers.